I'm working for years with my team on a pretty large Elixir / Phoenix code base, and although we are all very sensitive to unit and automated testing, we have been a bit lax regarding test coverage.
Over the past year, we started refactoring a large part of our UI from React to Phoenix Liveview with a more thorough testing approach (because LiveView testing is 🔥) and have been wondering: how much better is our test harness?
If you can’t measure it, you can’t improve it - Peter Drucker
In this article, I will help you build the appropriate tooling to track and measure your test coverage, and hopefully improve it.
Iterative feedback

Bot chat
As new code is produced and shipped, it’s very legit to question to wonder « is this code tested well enough to be merged? ».
The best place to have this kind of conversation between a contributor and a peer reviewer is a pull request (we use GitHub’s), so we will leverage our existing CI process to let us know how well our new feature is tested.
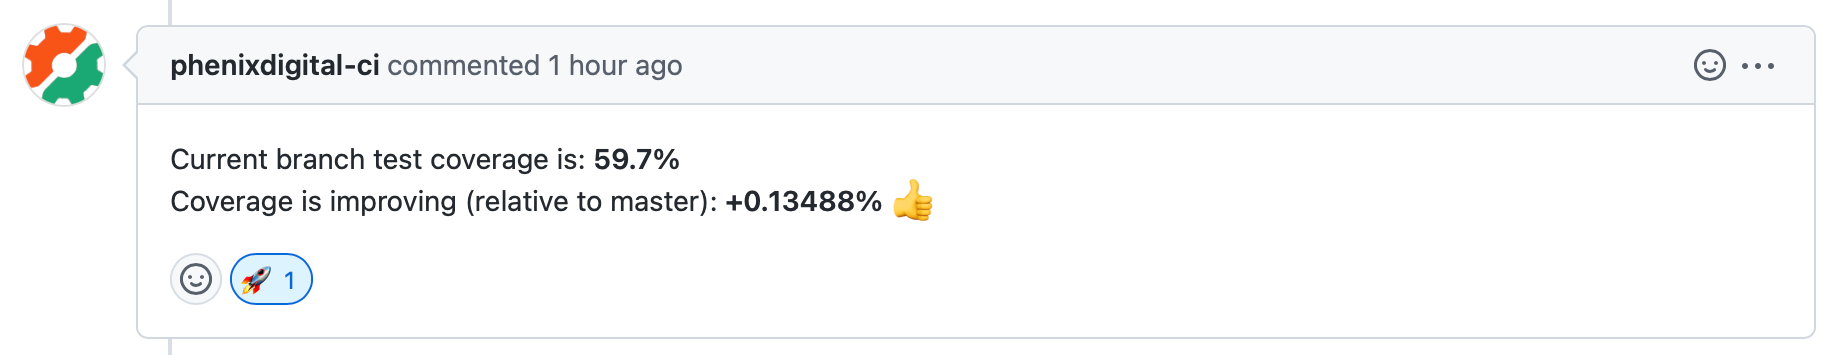
The screenshot above illustrates what we aim at:
- a PR comment, easy to scan & read 💬
- a short feedback loop (one should not have to wait for hours) ⚡️
- fully automated (posted by your CI) 🤖
Tweak the CI
The first and foremost thing to do is to compute test coverage, locally. As Elixir developers, we are gifted with a wonderful library: ExCoveralls. It's quite simple to use (locally at least), and I will not give a thorough setup guide as the library itself is well documented.
When the library is set up you can run the following commands:
mix coveralls.htmlto get a formatted HTML page displaying coverage informationmix coveralls.jsonto get the same data as JSON which could be interesting for automation (beware, there is a plot twist 👀 )
Now, let's have a look at our CI. We have been using Semaphore CI for years and are very satisfied with it (this article is not sponsored whatsoever). But I'm certain you can use the CI tool of your choice, provided you have access to partition & caching features.
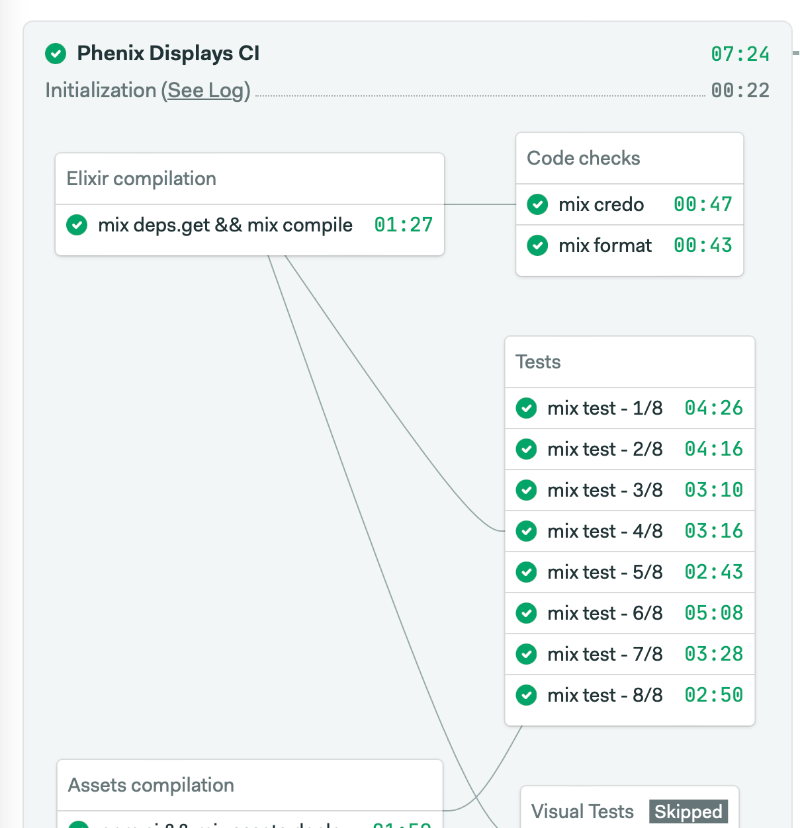
The screenshot above is our Semaphore pipeline. The important thing to notice is that our tests have been partitioned to get faster build feedback (please look at this post if you want more details about test partitioning).
Partitioning is very structuring in the way we compute code coverage: we cannot use mix coveralls.json as-is in a new CI task as it would re-run all tests in a lengthy monolithic process, defeating the purpose of test partitions.
What we need is a way to run test coverage, partition-wise, and then collect & merge all data (map-reduce style). To do so, we will switch to another coverage output format that can be easily merged afterward: LCOV.
First, we change the mix test call to mix coveralls.lcov that will both run tests and compute coverage, with partitions and umbrella app support. Test coverage output (the cover/lcov.info file) is stored in SemaphoreCI cache so that data can be retrieved in a subsequent job.
MIX_ENV=test MIX_TEST_PARTITION=$SEMAPHORE_JOB_INDEX mix coveralls.lcov --parallel --umbrella --partitions $SEMAPHORE_JOB_COUNT`
mv cover/lcov.info cover/lcov-$SEMAPHORE_JOB_INDEX.info
cache store coverage-$SEMAPHORE_WORKFLOW_ID-$SEMAPHORE_JOB_INDEX cover
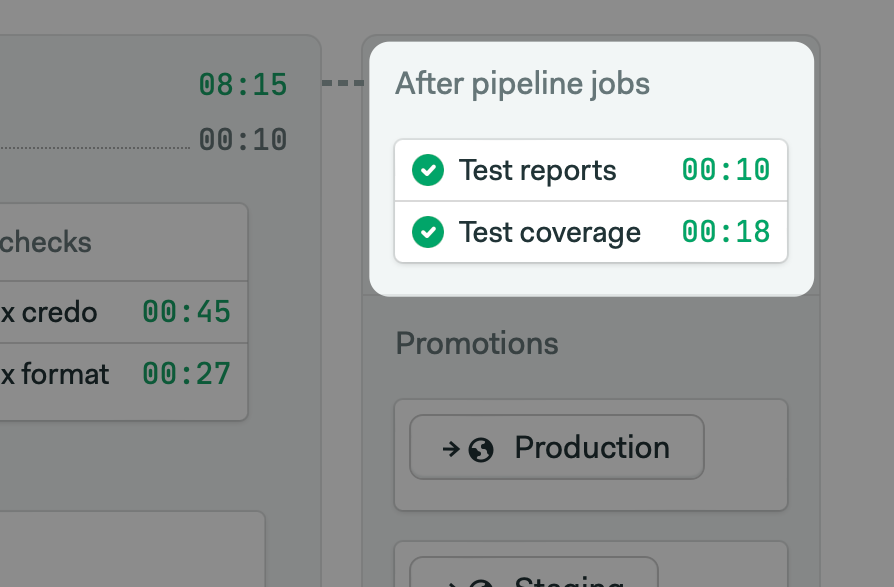
Then we use an after_pipeline semaphore task to collect all coverage files and merge them using the lcov binary.
for i in {1..8}; do cache restore coverage-$SEMAPHORE_WORKFLOW_ID-$i; done
find ./cover -name "lcov-*.info" -exec echo -a {} \; | xargs lcov -o cover/lcov.info
At this moment, you have a single lcov.info file that contains data for the whole project:
~/code/elixir-project ⇒ lcov --summary cover/lcov.info
Reading tracefile coverage/lcov.info
Summary coverage rate:
  lines......: 59.6% (10440 of 17503 lines)
  functions..: no data found
  branches...: no data found
The next step is to post coverage data to GitHub. For that purpose, we're using the following shell script; I won't delve into tedious shell intricacies, but here is what you need to know about this script:
- we use gh CLI to check if a pull request has been opened for the current branch
- we parse the
lcov.infooutput usinglcov --summary,grepandcut - we use the semaphore CI artifact API to store
lcov.infofor each branch. This way we can compare current branch coverage to master's (we do some basic maths withcalcbinary) - we use
ghonce again to post the pull request comment, and store the comment URL into semaphore cache. This way later builds will be able to update a single PR comment instead of posting a new one each time.
You now have all the elements to get fast and iterative feedback on your application test coverage!
Improve your coverage
Pull request comments are great to get instant feedback regarding the global trend of test coverage, but it doesn't provide any detailed insight whatsoever. If you want to improve your code coverage, you need to get in-depth information about what code is already tested and what code has insufficient coverage.
For this purpose, we chose to rely on our main code editor: VSCode. It has a great plugin ecosystem and searching on the marketplace for lcov allowed us to find two great extensions that fit our needs.
- Koverage to visualize code coverage of your project as a treeview
- Coverage Gutters to visualize line-per-line test coverage of any single file
Since coverage files are quite long to generate (on our project, we need about 15 to 20mn to run our full test suite) we will leverage our CI which is already computing lcov files for every branch. We just need to add the following line to our semaphore pipeline to make the lcov file available as a project artifact:
artifact push project cover/lcov.info --destination coverage/$SEMAPHORE_GIT_BRANCH/lcov.info --force
Then the following shell script can be used to download lcov from CI for the current working branch (given CI has already been run once).
project_id="redacted"
current_branch=$(git rev-parse --abbrev-ref HEAD)
coverage_dir="coverage"
local_path="$coverage_dir/lcov.info"

if [ -n "$SEMAPHORE_TOKEN" ]; then
  url_encoded_path=$(jq -R -r @uri <<< "coverage/$current_branch/lcov.info")
  url="https://org.semaphoreci.com/projects/$project_id/artifacts/$url_encoded_path"

  mkdir -p $coverage_dir
  curl -s -f -L -H "Authorization: Token $SEMAPHORE_TOKEN" $url --output $local_path

  if [ $? -eq 0 ]; then
    echo "test coverage has been downloaded at local path $local_path"
  else
    echo "could not download test coverage from $url"
  fi
else
  echo "please set SEMAPHORE_TOKEN in .env"
  echo "grab your token there: https://me.semaphoreci.com/account"
fi
We then run this script with a custom mix alias: mix coverage: here is a video of what everything looks like.
Final words
I hope this article will help you track and improve your software testing strategy. I'm sure this approach can still be improved and if you have any ideas, feel free to drop a comment below.